
Micheál L. Collins
Introduction
Judged in an international context, Ireland is a high income country. The 2014 United Nations Human Development Report ranks Ireland as having the 28th highest gross national income per person in the world – with an average income at almost two and a half times the world average.1 Data from the Central Statistics Office (CSO) show that average incomes, also measured as gross national income per person, stood at €32,599 in 2013 – a historically high figure, though lower than the peaks achieved in the years immediately before the recent economic recession.2
However, while overall averages are interesting, they assume an equal distribution of income across the population. In reality, income is not so evenly spread.
This article deals with the recent history of Ireland’s income distribution. Over the past decade, there have been significant improvements in the regularity with which income distribution data have been collected and published, and these sources serve as the basis for the analysis in this article. Overall, the story is one of limited change in the structure of the distribution, although incomes notably declined in the recession. However, beneath the headline indicators there lies an important story of growing divides in earned income and the growing role which the State plays in countering this inequality through the redistributive system.
Understanding the nature, shape and composition of the income distribution is an important component of our understanding of society and the appropriateness of various policy options. In the context of considerations of policy changes (to taxes, welfare payments or public services) or changes to earnings levels (both high incomes and low incomes) it is useful to ground considerations in an understanding of the incomes experienced in society.
Data and Income Definitions
The analysis in this article draws on the modelling and analysis of income distribution in the Republic of Ireland being undertaken by the Nevin Economic Research Institute (NERI). That work and the data presented here come from analysis of the Survey on Income and Living Conditions (SILC) carried out by the Central Statistics Office. SILC is part of a Europe-wide household living standards survey and collects information on income and living standards from a representative national sample.
The most recent data, for 2012, comprised responses from 11,891 individuals in 4,592 households. Over the previous seven years covered in the analysis below (i.e., 2005 to 2011), the sample size ranged between 11,000 and 13,000 individuals and between 4,000 and 5,800 households. SILC data corrects for under-representation and non-response and the collected income data is reconciled by the CSO with tax records in an attempt to ensure its accuracy.
Like all survey data sources, the SILC dataset, and consequently any analysis drawn from it, is subject to some caveats. In particular, income surveys tend to experience lower response rates from high income households, a feature which may result in a downwards bias in some of the averages reported later. Similarly, successful sampling for low-income households and minorities can be difficult to achieve, while those in institutions are excluded from the sample. However, the SILC remains the most detailed and robust data source available for Irish individual and household income and offers the most comprehensive method for examining Ireland’s income distribution.
The reason that income distribution surveys, such as SILC, collect and examine data for households is that members of households, be they working, unemployed, disabled, ill, retired or children, generally live together as unit and base their living standards on their collective income. In some cases, households can consist of one person only, while in other cases the household incorporates multiple individuals across the lifecycle. An understanding of household income is important because policy is often considered and critiqued on the basis of its impact on household or family income.
The SILC data provide information on the distribution of three income concepts: direct income, gross income and disposable income. Direct income captures earnings from various sources (cash and non-cash earnings, self-employment profits, private pensions, rental income and investments). Gross income represents direct income plus all forms of social welfare entitlements (including child benefits and old age pensions). Finally, disposable income is calculated as gross income minus any tax and social contributions paid. As such, it is a measure of the income which households have to live off and is the core income concept used to measure income distribution.
As two households on the same income may experience different standards of living because of variations in household size and composition (adults and children), the data are adjusted to account for these differences. That process, known as equivalisation, adjusts household incomes to an income per-adult basis using the national equivalence scale.3
Following equivalisation, households have been ranked by gross income and divided into deciles – ten per cent groups of the household population spanning the 10 per cent with the lowest income (the bottom decile) to the 10 per cent with the highest income (the top decile). These equivalised household deciles can then be used to profile the income distribution, and the changes to it that occur over time.
Distribution Trends
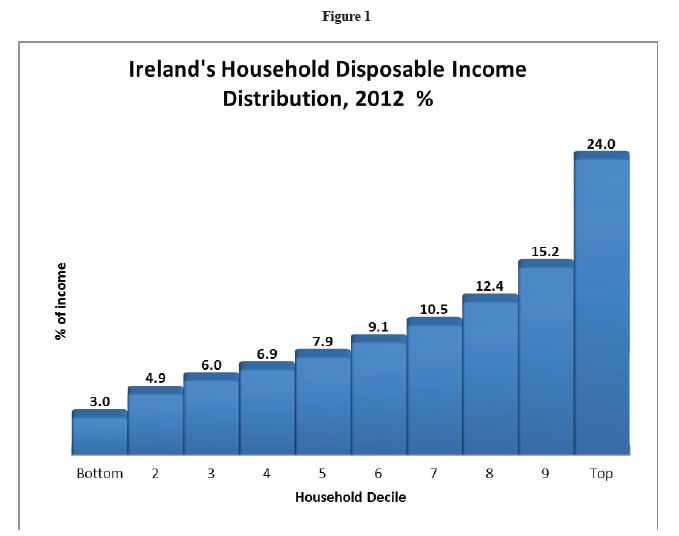
Table 1 (below) and Figure 1 (p. 5) outline the distribution of disposable income in Ireland across the income deciles since 2005. In 2012, those in the top 10 per cent of the income distribution received 24 per cent of all disposable income while those in the bottom decile received 3 per cent. The combined share of the two lowest deciles (7.9 per cent) equates to just one-third of that received by the top 10 per cent.
Looking across the data, the overall trend is one of stability. Despite the data covering periods of economic boom and bust, the shares of the bottom 20 per cent have remained at around 8 per cent; the share of the top 10 per cent has been between 24 and 25 per cent; the top 20 per cent have received 38 to 40 per cent of the income share, and the bottom half of the distribution has stood at between 28 and 30 per cent. Of course, while these shares have been stable, the overall amount of income being distributed grew to a peak in 2008 and subsequently fell. Using average household income figures (see Table 1), disposable incomes climbed 21 per cent in the period from 2005 to 2008, before falling 17 per cent from 2008 to 2012.
In an attempt to simplify the interpretation of income inequality/distribution data, there are a number of summary measures available. These reduce the trends to one number offering a snapshot of the distribution and facilitating comparisons over time.
Table 1
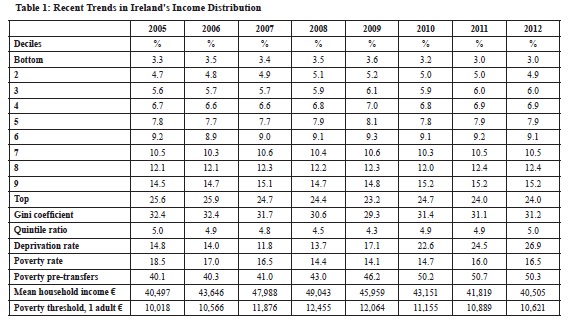
Figure 1
The two most prominent of these measures are listed in the table, namely, the Gini coefficient and the quintile ratio. The former, named after its proposer, the Italian sociologist and statistician Corrado Gini, ranges from 0 to 100, with higher scores reflecting a greater degree of inequality in the distribution. The latter measure, the quintile ratio, compares the shares of the bottom 20 per cent and the top 20 per cent (quintiles).
In the case of Ireland’s income distribution, the aforementioned stability in the decile shares between 2005 and 2012 is, unsurprisingly, reflected in stable summary measures. The Gini has sat at around 30 to 32 and the quintile ratio at 4.5 to 5 over this eight year-period. Both measures dip in 2009, reflecting the unfolding economic crisis in and around that time, and the fact that this hit higher incomes and earners first before subsequently impacting right across the income distribution as austerity measures were implemented.
The Lowest Income Groups
In SILC, those on the lowest incomes are captured by assessing the numbers beneath a poverty line which is set at 60 per cent of median equivalised disposable income. While there are critiques of measuring poverty in this way, it represents a simple and easily-updatable empirical attempt to determine an income amount below which households and individuals are unlikely to have sufficient resources to participate in society.4
Between 2005 and 2009, the proportion of the population below the poverty line (at risk of poverty) declined from 18.5 to 14.1 per cent, a phenomenon predominantly driven by increases in the incomes of those dependent on social welfare payments at that time. Much of that progress dissipated as the recession took hold, with the poverty rate climbing back up to 16.5 per cent. Estimates by Social Justice Ireland suggest this increase represents an additional 120,000 people falling into poverty since 2009, with overall numbers standing at approximately 750,000 people in poverty, one-quarter of whom are children.5 These increases occurred even as the poverty line fell, in line with median incomes, during the period (see Table 1, p. 4).
Complementing the poverty rate is the deprivation rate measuring the proportion of the population indicating an inability to afford more than two of eleven basic items. These items include: two pairs of shoes; new, not second-hand, clothing; a warm waterproof coat; being able to heat the home; being able to afford to socialise; being able to afford a roast once a week; being able to buy presents for family once a year, and being able to replace worn-out furniture.6 As Table 1 shows, deprivation declined as overall income grew but then increased rapidly as the recession unfolded. By 2012, almost 27 per cent of the population were experiencing deprivation (in other words, they lacked two or more items from the list of eleven basic items). This contrasts with a deprivation rate of 11.8 per cent in 2007. The extent of deprivation among those in the lowest income groups is striking: the data for 2012 show that in the bottom three deciles of income distribution the proportion experiencing deprivation averaged 48 per cent.
And the Highest …
At the other end of the income distribution scale, there are no official data on the shares of income going to those at the very top. However, estimates by Nolan using income tax data suggest that in 2009, the latest year for which information is available, the top 1 per cent received 10.5 per cent of all the income.7 Although there are measurement challenges for this group, what is clear is that the skewed income distribution picture outlined above, and represented in Table 1, is in reality even more skewed towards those at the very top of the income distribution.
Pre-Distribution and Re-Distribution
Standing back from these stable trends in the income distribution, a number of questions arise. In particular, why is it the case that income inequality has, for the most part, remained stable while there have been considerable developments in social protection policies and expenditure?
An insight comes from a comparison between the proportion of the population who are classified as being in poverty before and after social transfers. In 2012, more than half the Irish population would sit below the poverty line were it not for social transfers. However, after income from welfare payments – including Child Benefit, old age pensions, disability payments, jobseeker payments, Family Income Supplement and so on – is taken into account, the proportion of the population below the poverty line falls to 16.5 per cent. This welfare induced decrease in the poverty rate is often cited as a measure of the effectiveness of the Irish welfare system, which is not an unreasonable conclusion, but as the data shows that system has been running hard to counter the inequity in the underlying pre-distribution.
In an earlier paper, this author looked at the structure of the gross household income distribution (earnings plus transfers) in 2011. In cash income terms, with no adjustments for household size and composition, this study shows that:
- 33 per cent of households had a gross income of less than €27,000
- 62 per cent of households had a gross income of less than €50,000
- The top 30 per cent of households had a gross income of more than €62,000 per annum
- The top 20 per cent of households had a gross income of more than €80,000 per annum
- 12 per cent of households had a gross income above €100,000 per annum
- 2 per cent of households had gross incomes above €200,000 per annum.8
Such a profile offers an often missing insight into the nature of income across the State and the large numbers of households living on low incomes – even after welfare transfers. Implicit in these figures is an underlying skewed direct (or earned) income distribution – ‘the pre distribution’. Many earn nothing, and are entirely dependent on transfers, while many others earn income but at low levels. Eurostat, using data from the 2010 Structure of Earnings Survey, estimated that 20.7 per cent of Irish workers were low paid – defined as those earning two-thirds or less of the national median gross hourly earnings.9 Complementing this, data from SILC points towards those at work (the working poor) as representing 12.6 per cent of all those at risk of poverty.
Challenges and Conclusions
On the surface, Ireland’s income distribution looks remarkably stable. However, underneath there is much going on. The large role played by social transfers in counteracting low incomes is remarkable. The sustainability of such a level of intervention, which is understandably exaggerated during the recent period of high unemployment but was still very high in earlier periods of full employment, is questionable. Indeed, in the context of an ageing population where other welfare commitments will naturally grow, it is not realistic to think that it will be feasible for the State’s social protection system to continue to play such a huge role in countering inequality.
That implies some policy directions for the years to come. To date, our attention has principally been on the disposable income distribution and on adopting various policy measures and reforms to improve it. While that should continue, it needs to be joined by a further focus on the direct income distribution, most particularly earnings, and policy attempts to address the skewed earnings distribution. Initiatives such as the living wage and other (earnings and tax) measures targeted at the working poor and those on low incomes should form part of such a response.10 Without them, if Ireland is to maintain its stable, but not so equal, income distribution, it will require more and more effort on the part of the State’s welfare system.
Notes
1. United Nations Development Programme, Human Development Report 2014 – Sustaining Human Progress: Reducing Vulnerabilities and Building Resilience, New York: UNDP, 2014.
2. Central Statistics Office, National Income and Expenditure 2013, Dublin: Stationery Office, October 2014. (http://www.cso.ie/en/media/csoie/releasespublications/documents/economy/2013/nie_2013.pdf)
3. For more information see Micheál L. Collins, Total Direct and Indirect Tax Contributions of Households in Ireland: Estimates and Policy Simulations, Dublin: Nevin Economic Research Institute, August 2014, NERI Working Paper, 2014/No. 18. (http://www.nerinstitute.net/download/pdf/household_tax_contributions_neri_wp18.pdf)
4. An alternative approach is provided by ‘Budget Standards’ measures such as the ‘Minimum Essential Standard of Living’ developed by the Vincentian Partnership for Social Justice (see www.budgeting.ie).
5. Social Justice Ireland, Poverty and Income Distribution – Policy Briefing, Dublin: Social Justice Ireland, 2014. (http://www.socialjustice.ie/sites/default/files/attach/publication/3375/2014-06-26-sjipolicybriefingonpovertyandincomedistribution.pdf)
6. For a complete list see Central Statistics Office, Survey on Income and Living Conditions 2012, Dublin: Stationery Office, 2014, p. 20. (http://www.cso.ie/en/media/csoie/releasespublications/documents/silc/2012/silc_2012.pdf)
7. See The World Top Incomes Database (http://topincomes.parisschoolofeconomics.eu/#Country:Ireland).See also Brian Nolan, ‘Long Term Trends in Top Income Shares in Ireland’, in A. B. Atkinson and T. Piketty (eds.), Top Incomes over the Twentieth Century: A Contrast Between Continental European and English-Speaking Countries, Oxford: Oxford University Press, 2007 and Brian Nolan, ‘Updating top income shares for Ireland 2000–2009’, The World Top Incomes Database, 21 May 2012. (http://topincomes.parisschoolofeconomics.eu/#Country:Ireland).
8. Micheál L.Collins, Household Income Distribution in the Republic of Ireland, Dublin: NERI, February 2014, NERI Research inBrief, No. 9. (http://www.nerinstitute.net/download/pdf/charts_from_neri_inbrief_february_2014.pdf)
9. Eurostat, ‘In 2010, 17% of employees in the EU were low-wage earners’, Statistics in Focus 48/2012, Luxembourg: Eurostat, 2012.
10. See ‘Living Wage Ireland’ (www.livingwage.ie). The Living Wage Ireland Technical Group is comprised of: Vincentian Partnership for Social Justice (VPSJ); Nevin Economic Research Institute (NERI); Social Justice Ireland; SIPTU (The Services, Industrial, Professional and Technical Union); Tasc.
Micheál Collins Ph.D. is Senior Research Officer at the Nevin Economic Research Institute (NERI).