
Introduction
Ireland has seen a dramatic economic boom over the past decade, with unprecedented levels of growth in employment and living standards. Unemployment has fallen very sharply and substantial numbers of migrants have been attracted to Ireland to work. Despite this, the numbers ‘at risk of poverty’ have grown – the ‘risk of poverty’ being a key measure of poverty among the EU’s indicators of social inclusion.1 There has also been considerable concern expressed about rising inequality and about core features of the strategy adopted by the Government to combat poverty.
‘At risk of poverty’
The EU measure of the proportion of the population ‘at risk of poverty’ is based on the percentage of persons falling below income thresholds set at 50 per cent and 60 per cent of median equivalised income. Figure 1 shows the trends in the percentage of persons in Ireland falling below these income thresholds between 1994 and 2005. It reveals that the percentage ‘at risk of poverty’ has risen significantly since 1994. Between 1994 and 2001, the period covered by the European Community Household Panel (ECHP) surveys, the percentage below the 60 per cent line rose from 16 to 22 per cent; when the 50 per cent line is used, a corresponding trend is evident. From 2003 onwards, the EU Survey on Income and Living Conditions (EU-SILC) replaced the discontinued ECHP survey. EU-SILC shows that in the years 2003 to 2005, there was a lower percentage below each of the income thresholds than in 2001. The extent to which this reflects differences between the two surveys rather than real changes is hard to assess. Even so, this still leaves the rates well above those seen in the mid-1990s.
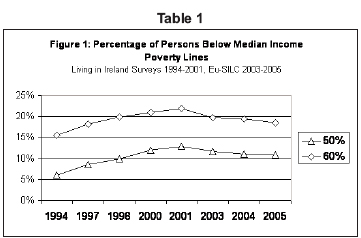
The trend shown in Table 1 reflects the pattern of increases in household incomes from 1994 onwards and the purely relative nature of the measure itself. From 1994 to 2005, median income, and thus the median-based income poverty thresholds, more than doubled in nominal terms. While social welfare support rates increased significantly in real terms (for example, means-tested support for the unemployed rose by over 20 per cent in real terms while state pensions for the elderly rose a good deal more rapidly) they lagged behind incomes from work and property, and thus behind average income. As a result, by the end of the period those relying primarily on social welfare for their income were more likely to fall below poverty lines linked to average income. The rapid increase in the number of married women in work over the period also contributed to the increase in median incomes, and some households with only one earner also failed to keep pace.
This has meant a major change in the type of households falling below the relative income thresholds. There has been a sharp decline in unemployed households but an increase in groups such as the ill and disabled, the retired and those in home duties; the proportion in work but on earnings below the thresholds also increased.
This overall trend would be very different if, instead of income thresholds linked to average income, a standard held constant in purchasing power terms was used. This can be illustrated by taking the 60 per cent of median income threshold in 1994 and indexing it to changes in the Consumer Price Index rather than average incomes. Using such a ‘constant in real terms’ line, the overall percentage falling below that threshold would have fallen from about 16 per cent in 1994 to about 2 per cent in 2001, and even lower by 2004. This reflects the scale of real income growth at all income levels seen over this remarkable period in Ireland. On that basis, poverty would have virtually disappeared by 2004.
Non-monetary indicators are particularly valuable in capturing trends in exclusion due to lack of resources, which is the widely-accepted definition of poverty.2 The ‘consistent poverty’ measure, combining both low income and ‘basic’ deprivation, which was developed at the ESRI, shows a marked decline over the period. In broad terms, using a fixed set of deprivation indicators, the percentage of the population living in consistent poverty appears to have fallen from 16 per cent to about 7 per cent.3 If we use a revised set of basic deprivation indicators for 2004/05 to take into account changes in ordinary living standards, the overall level of consistent poverty is still substantially lower than it was ten years earlier. The general increase in living standards observed across all groups over the decade has had a major impact in reducing generalised deprivation. In framing targets in its anti-poverty strategy, the Government has focused on consistent poverty: for example, the revised consistent poverty measure is to be a key indicator for the National Action Plan for Social Inclusion 2007–2016, which was published in February 2007.4
Increasing Inequality?
Turning from poverty to the distribution of income, it has been commonly assumed that Ireland’s economic boom has been accompanied by a sharp rise in income inequality. However, the available data from household surveys do not reflect such a rise. There was little change in overall income inequality between the Household Budget Survey carried out by the Central Statistics Office in 1994–1995 and that carried out in 1999–2000.5 The results from the EU-SILC survey initiated in 2003 show just a marginal increase in inequality by 2005.6 The share of total income going to the bottom 10 or 20 per cent has declined, but the pattern of change elsewhere in the distribution has meant very limited increase in overall inequality. However, Ireland continues to have a high degree of income inequality compared with many other European states, though still falling well short of the level seen in the United States. In other words, Ireland has a high degree of economic inequality in comparative terms after the boom, just as it did beforehand and indeed as far back as the early 1970s when nationally representative household survey data first became available.
Survey data may not capture what is happening at the top of the distribution, and data from the Revenue Commissioners can be used to look at trends in that respect. These suggest that by the end of the 1990s the share of the top 1 per cent was more than twice the level prevailing throughout the 1970s and 1980s. This seems to confirm the anecdotal assertions that those at the top did particularly well during the economic boom – though the data showing an increased share for the very top income earners may reflect the impact of changes in reporting behaviour vis-à-vis the tax authorities.
The Current Strategy
From the late 1980s, the central plank of the Irish Government’s strategy to combat poverty has been to get more people into work. This has been an unprecedented success in terms of the scale of employment growth and the reduction in unemployment achieved. The strategy has been a resounding success also in terms of improving living standards and reducing deprivation. This has had a positive impact on those in work throughout the period, and even more so on those moving from unemployment or inactivity into work. While those who remain outside the workforce have lagged behind in income terms, even they have seen significant improvements in living standards.
The level of social welfare payments remains the key determinant of the living standards of many households, notably older people, lone parents, and many of those affected by illness and disability. Government policy has paid particular attention to old age pensions, though as we have seen these have not kept pace with the very rapid rise in average incomes during the boom. Attention has also been paid to easing the transition from unemployment or inactivity into work for unemployed people and for lone parents, via a number of measures intended to reduce the ‘unemployment trap’ they can face on going into work as benefits are withdrawn.
The introduction of a National Minimum Wage in 2001 was intended to underpin the value of working as well as prevent the exploitation of workers. Its level has been increased since then, broadly in line with average earnings. In-work cash transfers complement the Minimum Wage, via the Family Income Supplement aimed at parents who are in work but on low household income. The problem of non-take-up of benefits is significant; options such a refundable tax credit have been examined but no clear strategy for reform has emerged. Those on the Minimum Wage have also been lifted out of the income tax net, though disincentive effects can then be faced as people move up the earnings distribution.
Concern about disincentives also focused attention on the broader range of policies aimed at helping families with children. Particular attention has been paid to universal cash transfers: for instance, Child Benefit has been very substantially increased in recent years, at significant Exchequer cost, and the system of cash support for children is now among the more generous in the EU.
Despite this, and the improvements in pensions, Ireland can be described as displaying a relatively low overall ‘redistributive effort’ and this is a key ingredient in its high level of income inequality compared with other rich countries. This again is not a new development; it is, rather, a long-standing characteristic of Ireland’ welfare state, with its heavy reliance on means-tested programmes and on flat-rate rather earnings-related transfers. Ireland in this respect has much in common with the UK, which also has a similar level of inequality in disposable incomes.
Key Issues
There are important issues to be addressed if the current anti-poverty strategy is to be pursued to its logical conclusion. These issues include:
How to ensure that the living standards of pensioners are linked more closely to those of people of working age, and the role which extending occupational pension coverage can play in achieving this.
- How to ensure that those in work are enabled to avoid poverty, through further reform of taxation and improved in-work benefits.
- How to ensure that more of those who have proved difficult to incorporate into the workforce, notably lone parents and those affected by disability, are provided with both incentives and assistance to enable them take up paid work.
- How to ensure that those of working age who remain dependent on social welfare are brought up to relative poverty thresholds through improved levels of payments.
However, the overarching issue facing policy-makers and indeed Irish society is whether the current strategy will get us where we want to be. The level of unemployment is remarkably low, and the level of economic growth remarkably high. Improving social protection to a relatively modest degree within the current model – and assuming continued economic success, which cannot be taken for granted – will undoubtedly help those who rely on it, but will not alter the fundamental underlying structures. It is these structures, and the low-tax model that they reflect, that place Ireland among the countries with a relatively high level of income inequality and a high proportion of people ‘at risk of poverty’. If it is believed that this is an essential ingredient in achieving the high economic growth – and the sharp reductions in deprivation and consistent poverty – which Ireland has seen since the mid-1990s, this might be a trade-off worth making. However, evidence from other countries suggests that this is not a choice Ireland needs to make: growth and employment can be maintained while promoting greater equality, though the global environment for doing so is ever more challenging.
Notes
1. The ‘risk of poverty’ is incorporated in the ‘Laeken Indicators’ – the EU’s agreed set of comparable indicators of poverty and social exclusion, which are regularly produced for every EU Member State.
2. ‘People are living in poverty if their income and resources (material, cultural and social) are so inadequate as to preclude them from having a standard of living which is regarded as acceptable by Irish society generally. As a result of inadequate income and other resources people may be excluded and marginalised from participating in activities, which are considered the norm for other people in society.’ This definition of poverty was first adopted by the Irish Government in the National Anti-Poverty Strategy (1997) and underpinned the National Action Plan against Poverty and Social Exclusion 2003–2005. It is again used in the National Action Plan for Social Inclusion 2007–2016 (Dublin: Stationery Office, 2007).
3. The precise scale of that decline has to be treated with caution because the switch from ECHP to EU-SILC in itself appears to have had an impact on the measured extent of deprivation.
4. The overall poverty goal of the National Action Plan for Social Inclusion 2007–2016 is: ‘To reduce the number of those experiencing consistent poverty to between 2% and 4% by 2012, with the aim of eliminating summary indicator of inequality – was 0.31 in the case of both the 1994–1995 House-hold Budget Survey and the 1999–2000 Survey.
6. The results from the EU-SILC survey show the Gini coefficient still at 0.31 in 2003, increasing marginally to 0.32 by 2005.